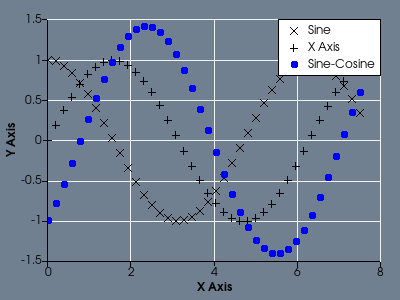
ScatterPlot
web-test/PythonicAPI/Plotting/ScatterPlot
Question
If you have a question about this example, please use the VTK Discourse Forum
Code
ScatterPlot.py
#!/usr/bin/env python3

import math

# noinspection PyUnresolvedReferences
import vtkmodules.vtkInteractionStyle
# noinspection PyUnresolvedReferences
import vtkmodules.vtkRenderingContextOpenGL2
# noinspection PyUnresolvedReferences
import vtkmodules.vtkRenderingOpenGL2
from vtkmodules.vtkChartsCore import (
    vtkChart,
    vtkChartXY,
    vtkPlotPoints
)
from vtkmodules.vtkCommonColor import vtkNamedColors
from vtkmodules.vtkCommonCore import vtkFloatArray
from vtkmodules.vtkCommonDataModel import vtkTable
from vtkmodules.vtkViewsContext2D import vtkContextView


def main():
    colors = vtkNamedColors()

    view = vtkContextView()
    view.renderer.background = colors.GetColor3d('SlateGray')
    view.render_window.size = (400, 300)

    chart = vtkChartXY(show_legend=True)
    view.scene.AddItem(chart)

    table = vtkTable()

    arr_x = vtkFloatArray(name='X Axis')
    arr_c = vtkFloatArray(name='Cosine')
    arr_s = vtkFloatArray(name='Sine')
    arr_t = vtkFloatArray(name='Sine-Cosine')

    table.AddColumn(arr_c)
    table.AddColumn(arr_s)
    table.AddColumn(arr_x)
    table.AddColumn(arr_t)

    num_points = 40

    inc = 7.5 / (num_points - 1)
    table.number_of_rows = num_points
    for i in range(num_points):
        table.SetValue(i, 0, i * inc)
        table.SetValue(i, 1, math.cos(i * inc))
        table.SetValue(i, 2, math.sin(i * inc))
        table.SetValue(i, 3, math.sin(i * inc) - math.cos(i * inc))

    points = chart.AddPlot(vtkChart.POINTS)
    points.input_data = (table, 0, 1)
    points.color = tuple(colors.GetColor4ub('Black'))
    points.width = 1.0
    points.marker_style = vtkPlotPoints.CROSS

    points = chart.AddPlot(vtkChart.POINTS)
    points.input_data = (table, 0, 2)
    points.color = tuple(colors.GetColor4ub('Black'))
    points.width = 1.0
    points.marker_style = vtkPlotPoints.PLUS

    points = chart.AddPlot(vtkChart.POINTS)
    points.input_data = (table, 0, 3)
    points.color = tuple(colors.GetColor4ub('Blue'))
    points.width = 1.0
    points.marker_style = vtkPlotPoints.CIRCLE

    view.render_window.multi_samples = 0
    view.render_window.window_name = 'ScatterPlot'
    view.interactor.Initialize()
    view.interactor.Start()


if __name__ == '__main__':
    main()
