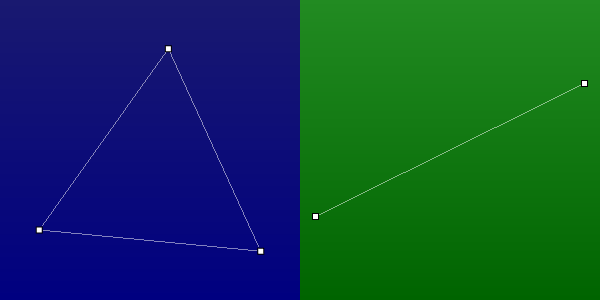
SideBySideGraphs
Repository source: SideBySideGraphs
Question
If you have a question about this example, please use the VTK Discourse Forum
Code
SideBySideGraphs.py
#!/usr/bin/env python3

# noinspection PyUnresolvedReferences
import vtkmodules.vtkInteractionStyle
# noinspection PyUnresolvedReferences
import vtkmodules.vtkRenderingOpenGL2
from vtkmodules.vtkCommonColor import vtkNamedColors
from vtkmodules.vtkCommonCore import vtkPoints
from vtkmodules.vtkCommonDataModel import vtkMutableUndirectedGraph
from vtkmodules.vtkRenderingCore import (
    vtkRenderWindow,
    vtkRenderWindowInteractor
)
from vtkmodules.vtkViewsInfovis import vtkGraphLayoutView


def main():
    colors = vtkNamedColors()

    # Create the first graph
    g0 = vtkMutableUndirectedGraph()

    v1 = g0.AddVertex()
    v2 = g0.AddVertex()
    v3 = g0.AddVertex()

    g0.AddEdge(v1, v2)
    g0.AddEdge(v2, v3)
    g0.AddEdge(v1, v3)

    # Create points
    points = vtkPoints()
    points.InsertNextPoint(0.0, 0.0, 0.0)
    points.InsertNextPoint(1.0, 0.0, 0.0)
    points.InsertNextPoint(0.0, 1.0, 0.0)

    # Add the coordinates of the points to the graph
    g0.points = points

    # Create the second graph
    g1 = vtkMutableUndirectedGraph()

    v1 = g1.AddVertex()
    v2 = g1.AddVertex()

    g1.AddEdge(v1, v2)

    # Create points
    points = vtkPoints()
    points.InsertNextPoint(0.0, 0.0, 0.0)
    points.InsertNextPoint(1.0, 0.0, 0.0)

    # Add the coordinates of the points to the graph
    g1.points = points

    # There will be one render window
    ren_win = vtkRenderWindow(size=(600, 300), window_name='SideBySideGraphs')

    iren = vtkRenderWindowInteractor()

    # Define viewport ranges
    # (xmin, ymin, xmax, ymax)
    left_viewport = [0.0, 0.0, 0.5, 1.0]
    right_viewport = [0.5, 0.0, 1.0, 1.0]

    graph_layout_view0 = vtkGraphLayoutView(render_window=ren_win, interactor=iren)
    graph_layout_view0.renderer.viewport = left_viewport
    graph_layout_view0.AddRepresentationFromInput(g0)
    # If we create a layout object directly, just set the pointer through this method.
    # graph_layout_view0.SetLayoutStrategy(force_directed)
    graph_layout_view0.SetLayoutStrategyToForceDirected()
    graph_layout_view0.renderer.background = colors.GetColor3d('Navy')
    graph_layout_view0.renderer.background2 = colors.GetColor3d('MidnightBlue')
    graph_layout_view0.Render()
    graph_layout_view0.ResetCamera()

    graph_layout_view1 = vtkGraphLayoutView(render_window=ren_win, interactor=iren)
    graph_layout_view1.renderer.SetViewport(right_viewport)
    graph_layout_view1.AddRepresentationFromInput(g1)
    # If we create a layout object directly, just set the pointer through this method.
    # graph_layout_view1.SetLayoutStrategy(force_directed)
    graph_layout_view1.SetLayoutStrategyToForceDirected()
    graph_layout_view1.renderer.background = colors.GetColor3d('DarkGreen')
    graph_layout_view1.renderer.background2 = colors.GetColor3d('ForestGreen')
    graph_layout_view1.Render()
    graph_layout_view1.ResetCamera()

    # graph_layout_view0.interactor.Start()
    iren.Start()


if __name__ == '__main__':
    main()
